Diagnosing a Malfunctioning Server
Insufficient CPU threads, too little RAM, or a slow disk are the main and most common causes of a poorly functioning server. In addition, it should be remembered that if a server that was working fine at the beginning now, while operating with the same parameters, may require their increase, which may be due to, for example, an increase in users of your website or application. It is worth monitoring the use of machine resources on an ongoing basis.
Statistics in the Client Panel
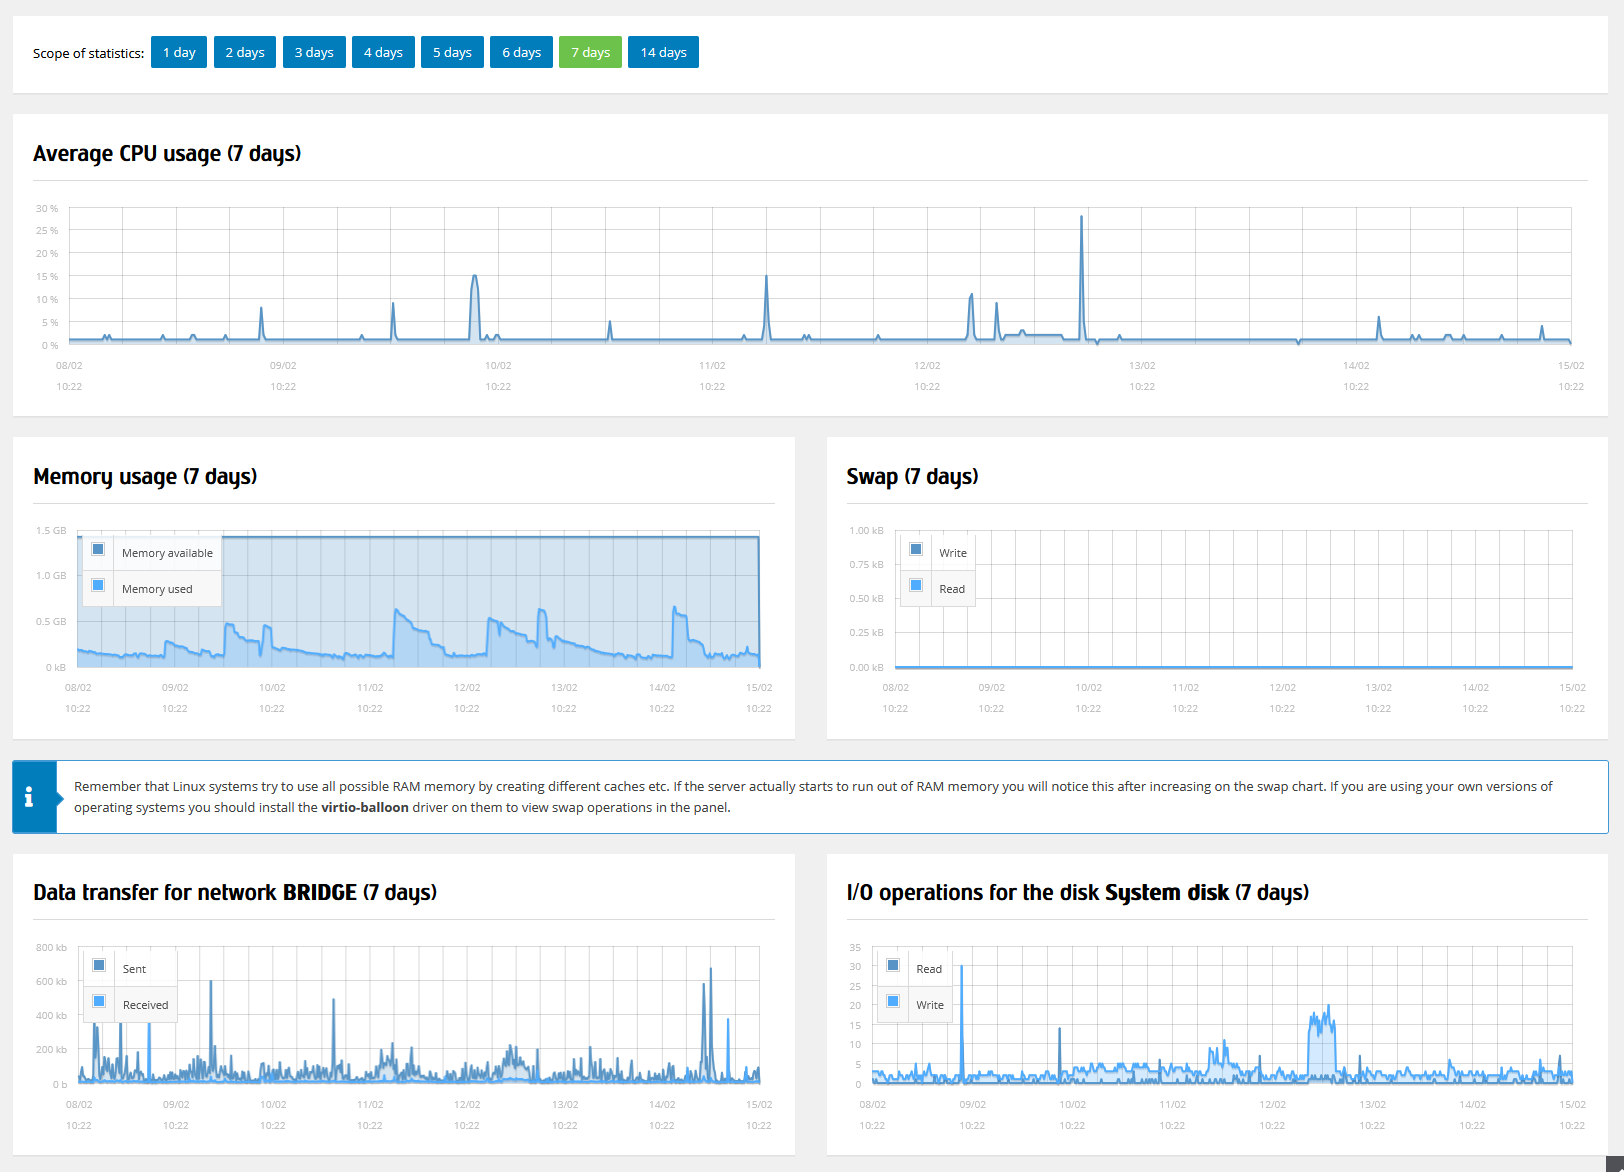
Statistics available in the Client Panel - they can be found in the detailed view of the server, i.e. immediately after logging into the panel, go to the Servers > e24cloud Servers tab, and then click on the server of interest. Resource consumption charts are visible at the bottom of the page. If necessary, we can change the selected range of data to see more accurate resource usage in a selected period of time.

Diagnosing from Linux System
Commands or other third-party software designed to list machine resource usage, run directly from the server console:
- free - diagnosing RAM memory and SWAP space usage
- top - diagnosing CPU/RAM usage
- htop - diagnosing CPU/RAM usage
- iotop - diagnosing hard disk usage
- ifstat - diagnosing network link usage
If we notice that the server is using a large amount of swap space, it may be a message that the machine is running out of operational memory. It should be remembered that the “swap” mechanism has a very negative impact on machine performance. Other reasons for running out of RAM:
- a newer version of a recently updated program (service) that causes many so-called “memory leaks”.
- launching an additional one or more services that use more and more memory over time.